Clari × Databricks
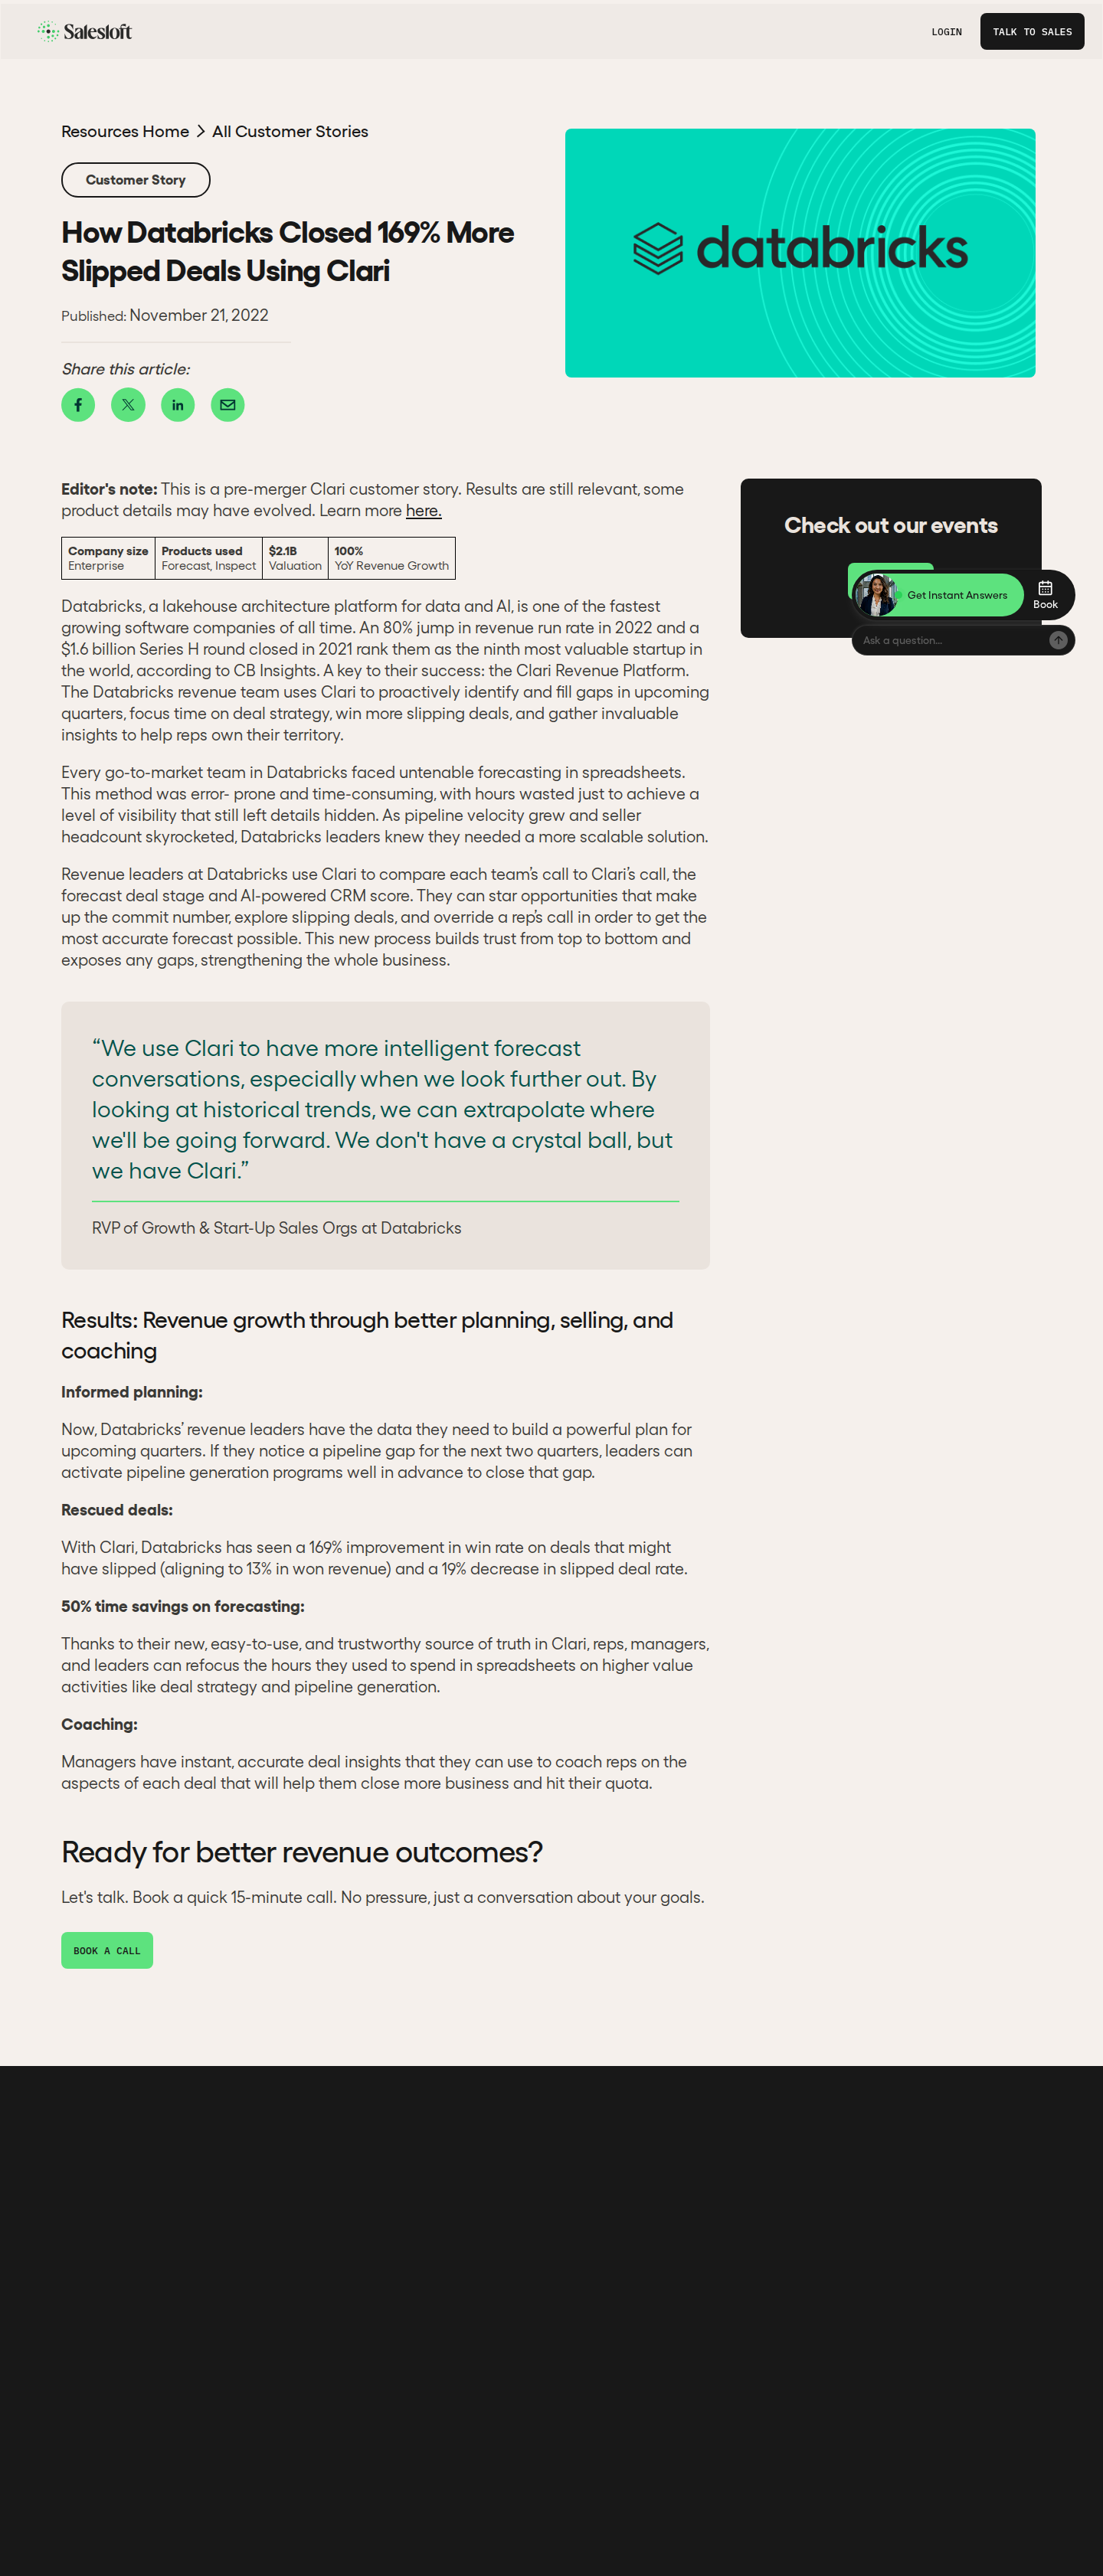
Clari x Databricks: 169% more slipped deals rescued
169% improvement in win rate on slipped deals
Spreadsheet guesswork to trusted revenue visibility
Members read free
Unlock the full breakdown
Enter your email to open every case study in the library: the full screenshot, why it works, and the one thing worth stealing. One email unlocks all of them.
Free. No spam. Unsubscribe anytime.
You're in — enjoy the library.
Why it works
The story leads with a sharp, counterintuitive number (winning more deals that were already slipping) rather than a generic revenue claim, which earns attention quickly. The before-state is concrete: spreadsheet forecasting was error-prone, time-consuming, and left gaps hidden even after hours of work. The piece doubles as a Breakthrough and Efficiency story, but the headline win-rate number keeps it anchored as Breakthrough by the tie-break rule.
Steal this
Lead with a rescue metric rather than a growth metric. Framing the win as 'slipped deals saved' rather than 'revenue increased' is more specific, more credible, and stands out in a category where every vendor claims pipeline growth.
 Click to enlarge ↗
 This is editorial commentary and curation. The case study, screenshot, and all metrics are Clari's published work; we link to the source and lead with our analysis.