Sentry × Animation Digital Network
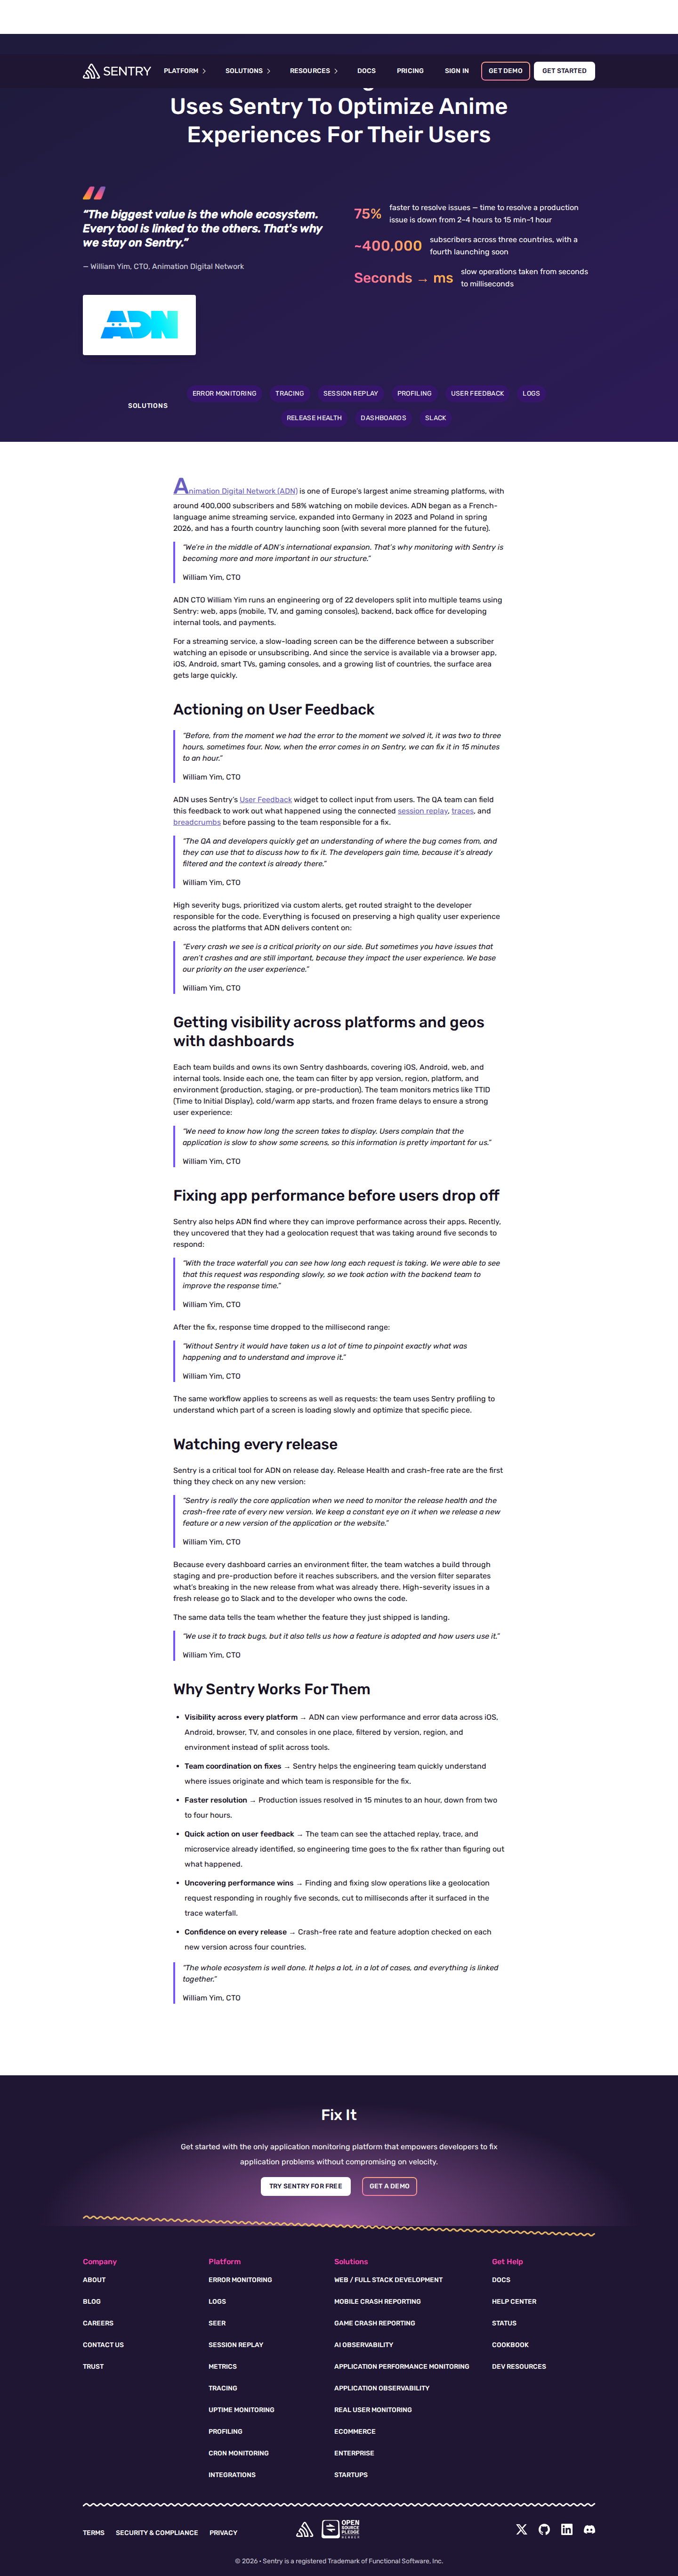
Sentry x Animation Digital Network, 75% faster issue resolution across a multi-platform anime streamer
75% faster to resolve issues — down from 2–4 hours to 15 min–1 hour
Slow, manual debugging to fast, context-rich resolution
Members read free
Unlock the full breakdown
Enter your email to open every case study in the library: the full screenshot, why it works, and the one thing worth stealing. One email unlocks all of them.
Free. No spam. Unsubscribe anytime.
You're in — enjoy the library.
Why it works
The case study earns its efficiency tag with a concrete before-and-after time figure (2–4 hours down to 15 min–1 hour) that is specific to this customer. The mechanism is explained in enough detail to follow: user feedback triggers a session replay and trace lookup by QA, context is handed to the owning developer, and high-severity alerts route directly via Slack. The secondary Clarity tag reflects a real second theme: the team could not see cross-platform performance (frozen frames, TTID, slow geolocation requests) until Sentry surfaced it, though efficiency is the clearer lead.
Steal this
The layered filtering structure (version, region, environment, platform) inside team-owned dashboards lets each squad watch only their slice of the system, which is a replicable dashboard architecture worth borrowing for any multi-platform product org.
 Click to enlarge ↗
 This is editorial commentary and curation. The case study, screenshot, and all metrics are Sentry's published work; we link to the source and lead with our analysis.